Seitenueberschrift
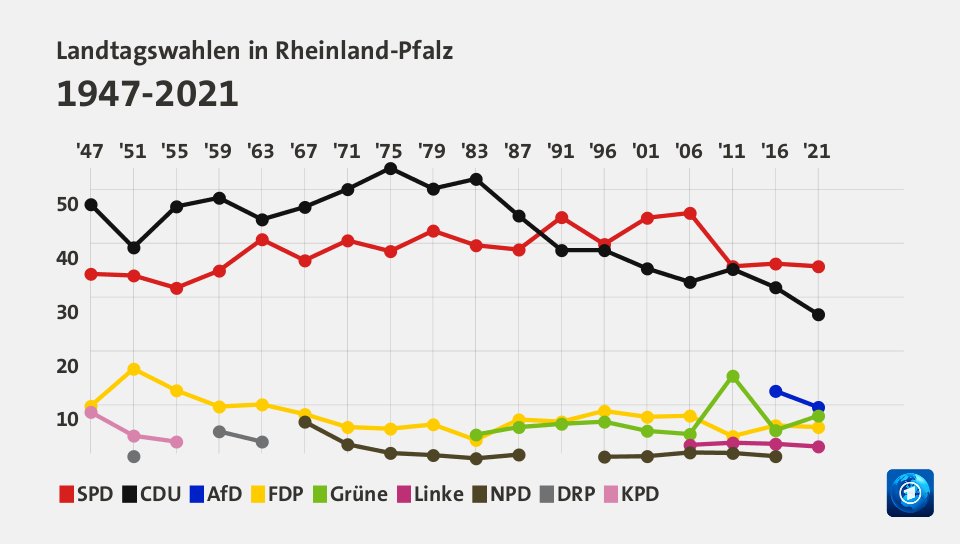
Landtagswahl 1987
Parteien unter 5 Prozent

Landtagswahl Rheinland-Pfalz 1987
Parteien unter fünf Prozent
| Partei | Prozent | Stimmen | |
|---|---|---|---|
FWG |
1,46 |
31.869 |
|
NPD |
0,84 |
18.227 |
|
ÖDP |
0,44 |
9.580 |
|
DKP |
0,13 |
2.734 |
|
Patrioten |
0,08 |
1.634 |


